Style Plotly Plots#
This guide demonstrates how to style Plotly plots using the Plotly pane. You can customize your plots with Plotly’s built-in templates, available in plotly.io.templates. For more details, refer to the Plotly Templates Guide.
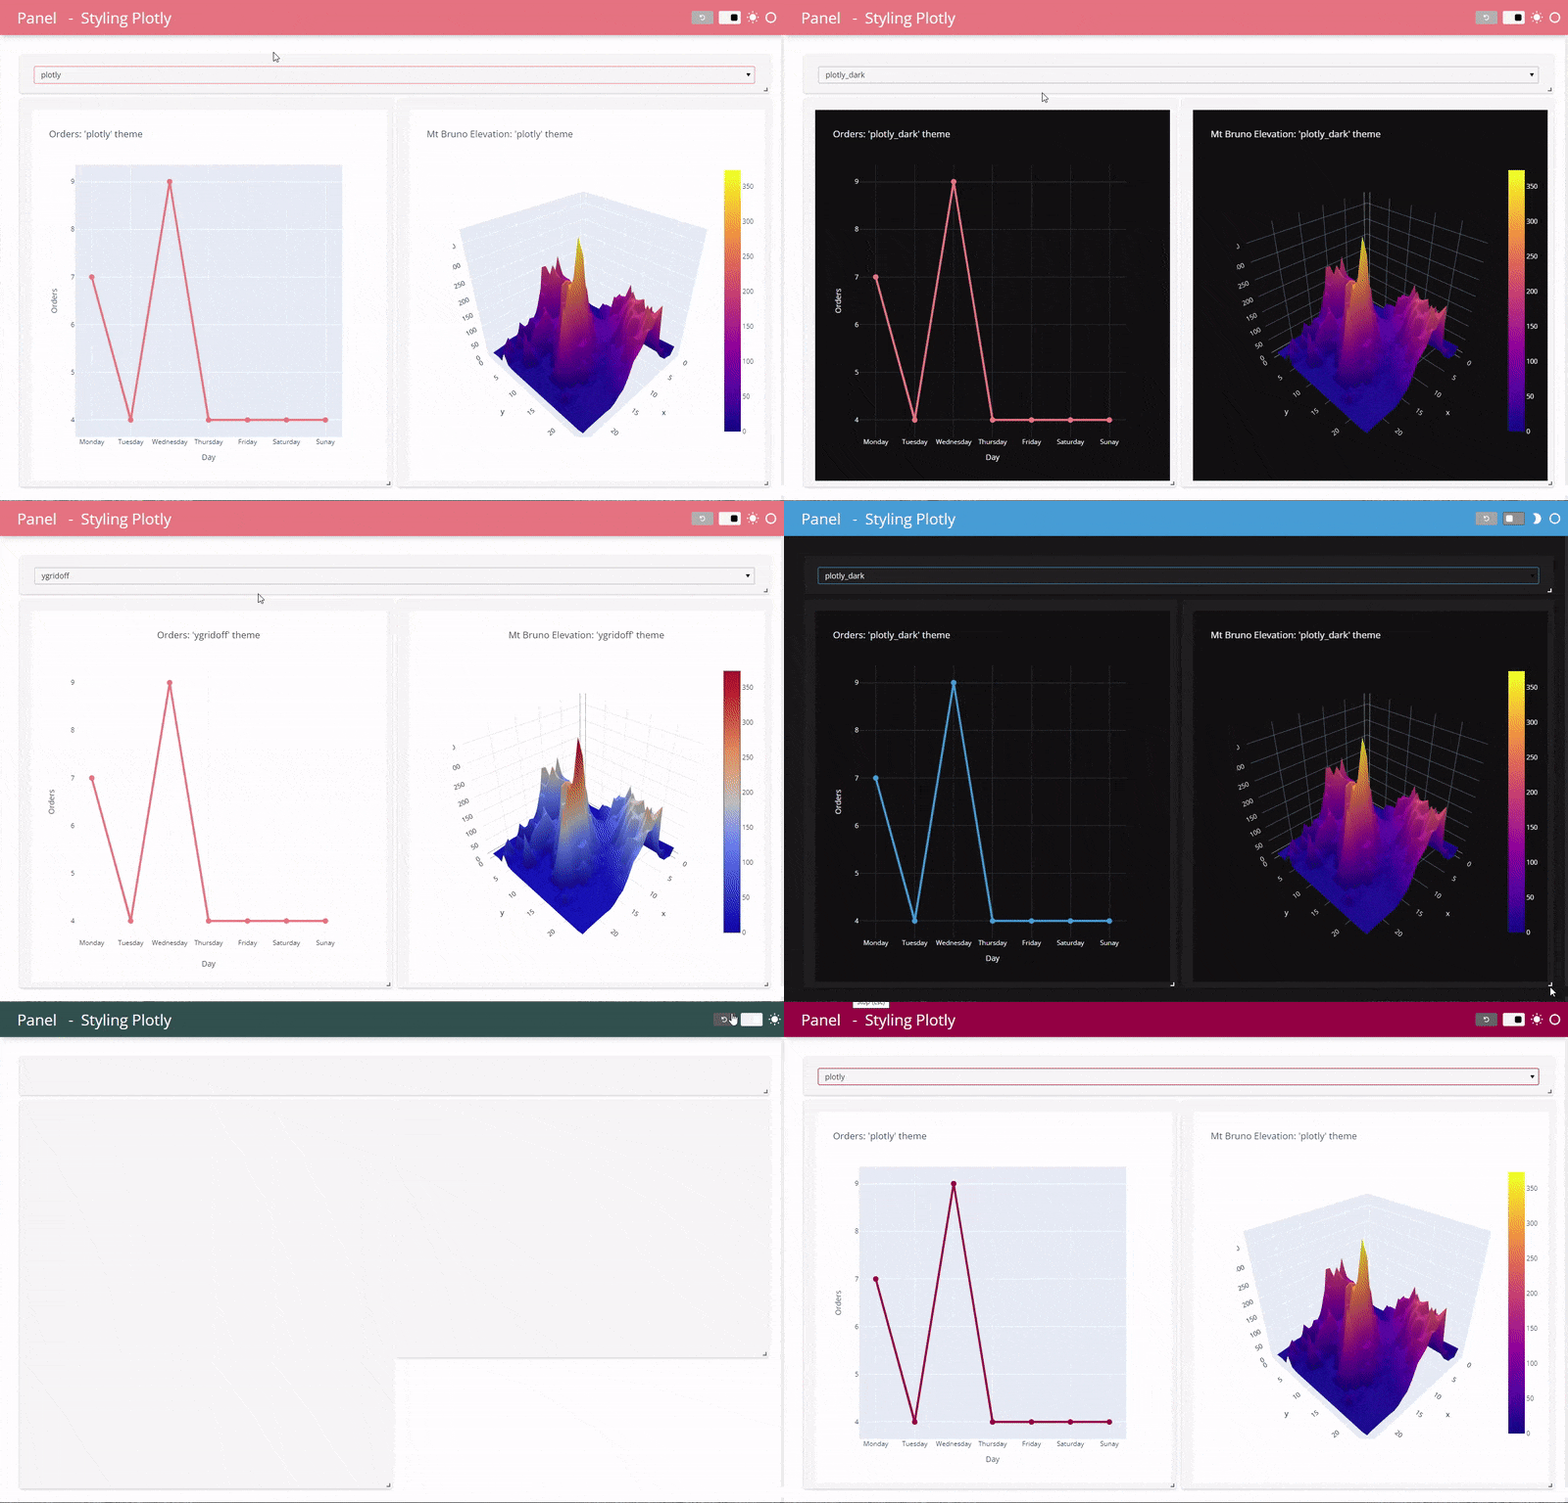
The GIF below illustrates the possibilities when you style a Plotly plot with FastGridTemplate.

Creating a Plotly Express Plot with a Custom Theme and Accent Color#
In this example, you’ll apply a dark theme and a custom accent color to a Plotly Express plot.
import pandas as pd
import plotly.express as px
import plotly.io as pio
import panel as pn

pn.extension("plotly")

# Sample data
data = pd.DataFrame(
    [
        ("Monday", 7),
        ("Tuesday", 4),
        ("Wednesday", 9),
        ("Thursday", 4),
        ("Friday", 4),
        ("Saturday", 4),
        ("Sunday", 4),
    ],
    columns=["Day", "Orders"],
)

# Function to create the plot
def plot(template, color):
    fig = px.line(
        data,
        x="Day",
        y="Orders",
        template=template,
        color_discrete_sequence=[color],
        title=f"Template: {template}",
    )
    fig.update_traces(mode="lines+markers", marker=dict(size=10), line=dict(width=4))
    fig.layout.autosize = True
    return fig

# Widget for template selection and color picker
templates = sorted(pio.templates)
template = pn.widgets.Select(value="plotly_dark", options=templates, name="Template")
color = pn.widgets.ColorPicker(value="#F08080", name="Color")

# Display the plot and widgets
pn.Column(
    pn.Row(template, color),
    pn.pane.Plotly(pn.bind(plot, template, color), sizing_mode="stretch_width"),
    "**Plotly Templates**: " + ", ".join(templates),
).servable()
Styling a Plotly go.Figure Plot with a Dark Theme#
This example shows how to apply a dark theme to a Plotly go.Figure plot.
import pandas as pd
import plotly.graph_objects as go
import panel as pn

pn.extension("plotly")

# Choose a template
TEMPLATE = "plotly_dark"

# Load data for the plot
z_data = pd.read_csv("https://raw.githubusercontent.com/plotly/datasets/master/api_docs/mt_bruno_elevation.csv")

# Create a 3D surface plot
fig = go.Figure(
    data=go.Surface(z=z_data.values),
    layout=go.Layout(
        title="Mt Bruno Elevation",
    )
)
fig.layout.autosize = True
fig.update_layout(template=TEMPLATE, title=f"Mt Bruno Elevation in '{TEMPLATE}' template")

# Display the plot
pn.pane.Plotly(fig, height=500, sizing_mode="stretch_width").servable()
Changing the Default Theme in Plotly Express#
You can change the default Plotly Express template based on the pn.config.theme setting:
import plotly.express as px

px.defaults.template = "plotly_dark" if pn.config.theme == "dark" else "plotly_white"
Changing Plotly Template Defaults#
For example, you can set paper_bgcolor and plot_bgcolor to transparent:
import plotly.io as pio

for theme in ["plotly_dark", "plotly_white"]:
    pio.templates[theme].layout.paper_bgcolor = 'rgba(0,0,0,0)'
    pio.templates[theme].layout.plot_bgcolor = 'rgba(0,0,0,0)'
    pio.templates[theme].layout.legend = dict(orientation="h", yanchor="bottom", y=-0.2)
    pio.templates[theme].layout.bargap = 0.2


