Style Vega Plots#
This guide addresses how to style Vega plots displayed using the Vega pane.
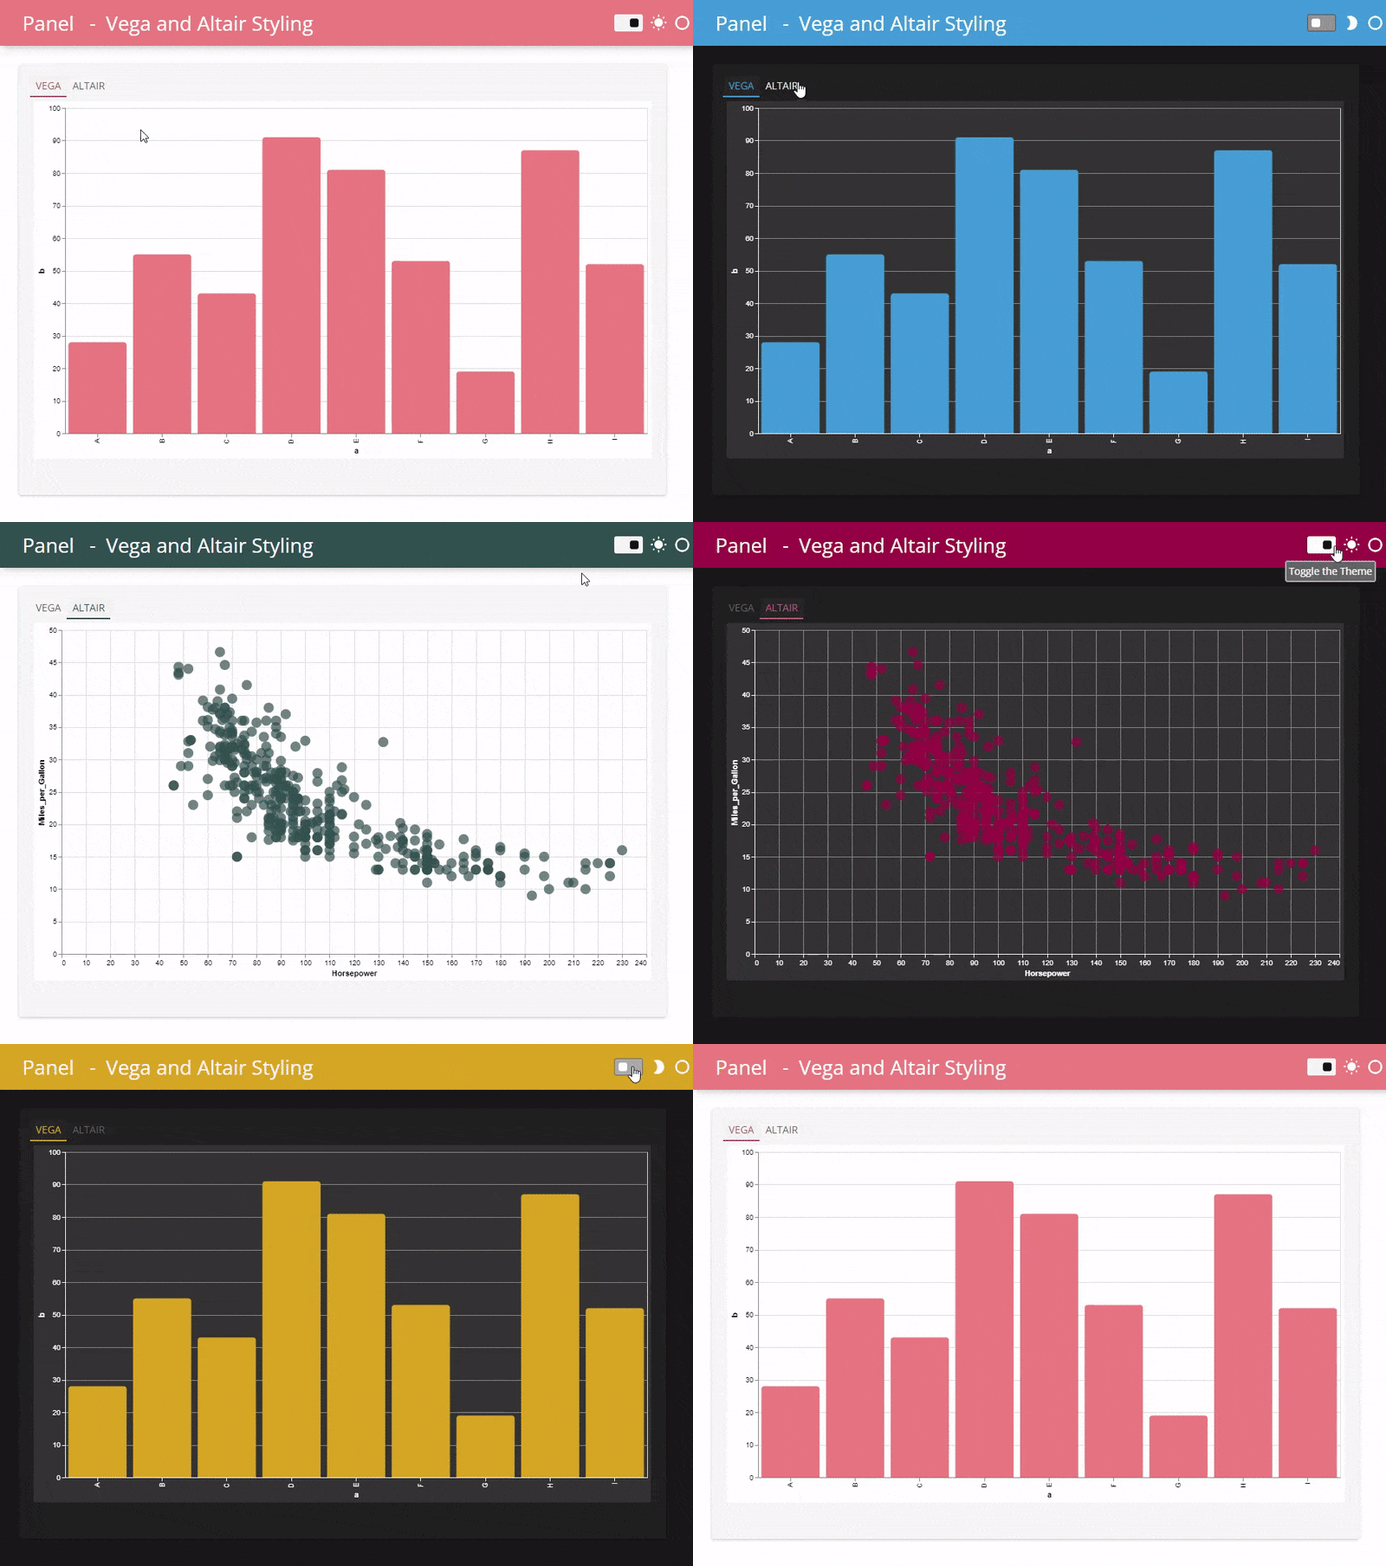
The gif below displays an example of what can be achieved with a little styling of the Vega plot and the FastListTemplate.

A Vega plot with dark theme and accent color#
In this example we will give the Vega Plot a dark theme and a custom accent color.
import panel as pn

from vega_datasets import data

pn.extension("vega")

VEGA_ACCENT_COLOR = "#F08080"
VEGA_THEME = {
    "background": "#333",
    "title": {"color": "#fff"},
    "style": {"guide-label": {"fill": "#fff"}, "guide-title": {"fill": "#fff"}},
    "axis": {"domainColor": "#fff", "gridColor": "#888", "tickColor": "#fff"},
}

vegalite = {
    "$schema": "https://vega.github.io/schema/vega-lite/v5.json",
    "description": "A simple bar chart with rounded corners at the end of the bar.",
    "width": "container",
    "height": 300,
    "data": {
    "values": [
        {"a": "A", "b": 28},
        {"a": "B", "b": 55},
        {"a": "C", "b": 43},
        {"a": "D", "b": 91},
        {"a": "E", "b": 81},
        {"a": "F", "b": 53},
        {"a": "G", "b": 19},
        {"a": "H", "b": 87},
        {"a": "I", "b": 52}
    ]
    },
    "mark": {"type": "bar", "cornerRadiusEnd": 4, "tooltip": True},
    "encoding": {
        "x": {"field": "a", "type": "ordinal"},
        "y": {"field": "b", "type": "quantitative"},
        "color": {"value": VEGA_ACCENT_COLOR}
    },
}

vegalite["config"] = VEGA_THEME

pn.pane.Vega(vegalite, height=350, sizing_mode="stretch_width").servable()


