Style Altair Plots#
This guide addresses how to style Altair plots displayed using the Vega pane.
You can select the theme of Altair plots using altair.themes.enable and an accent color using the configure_mark method. The list of themes is available via altair.themes.names().
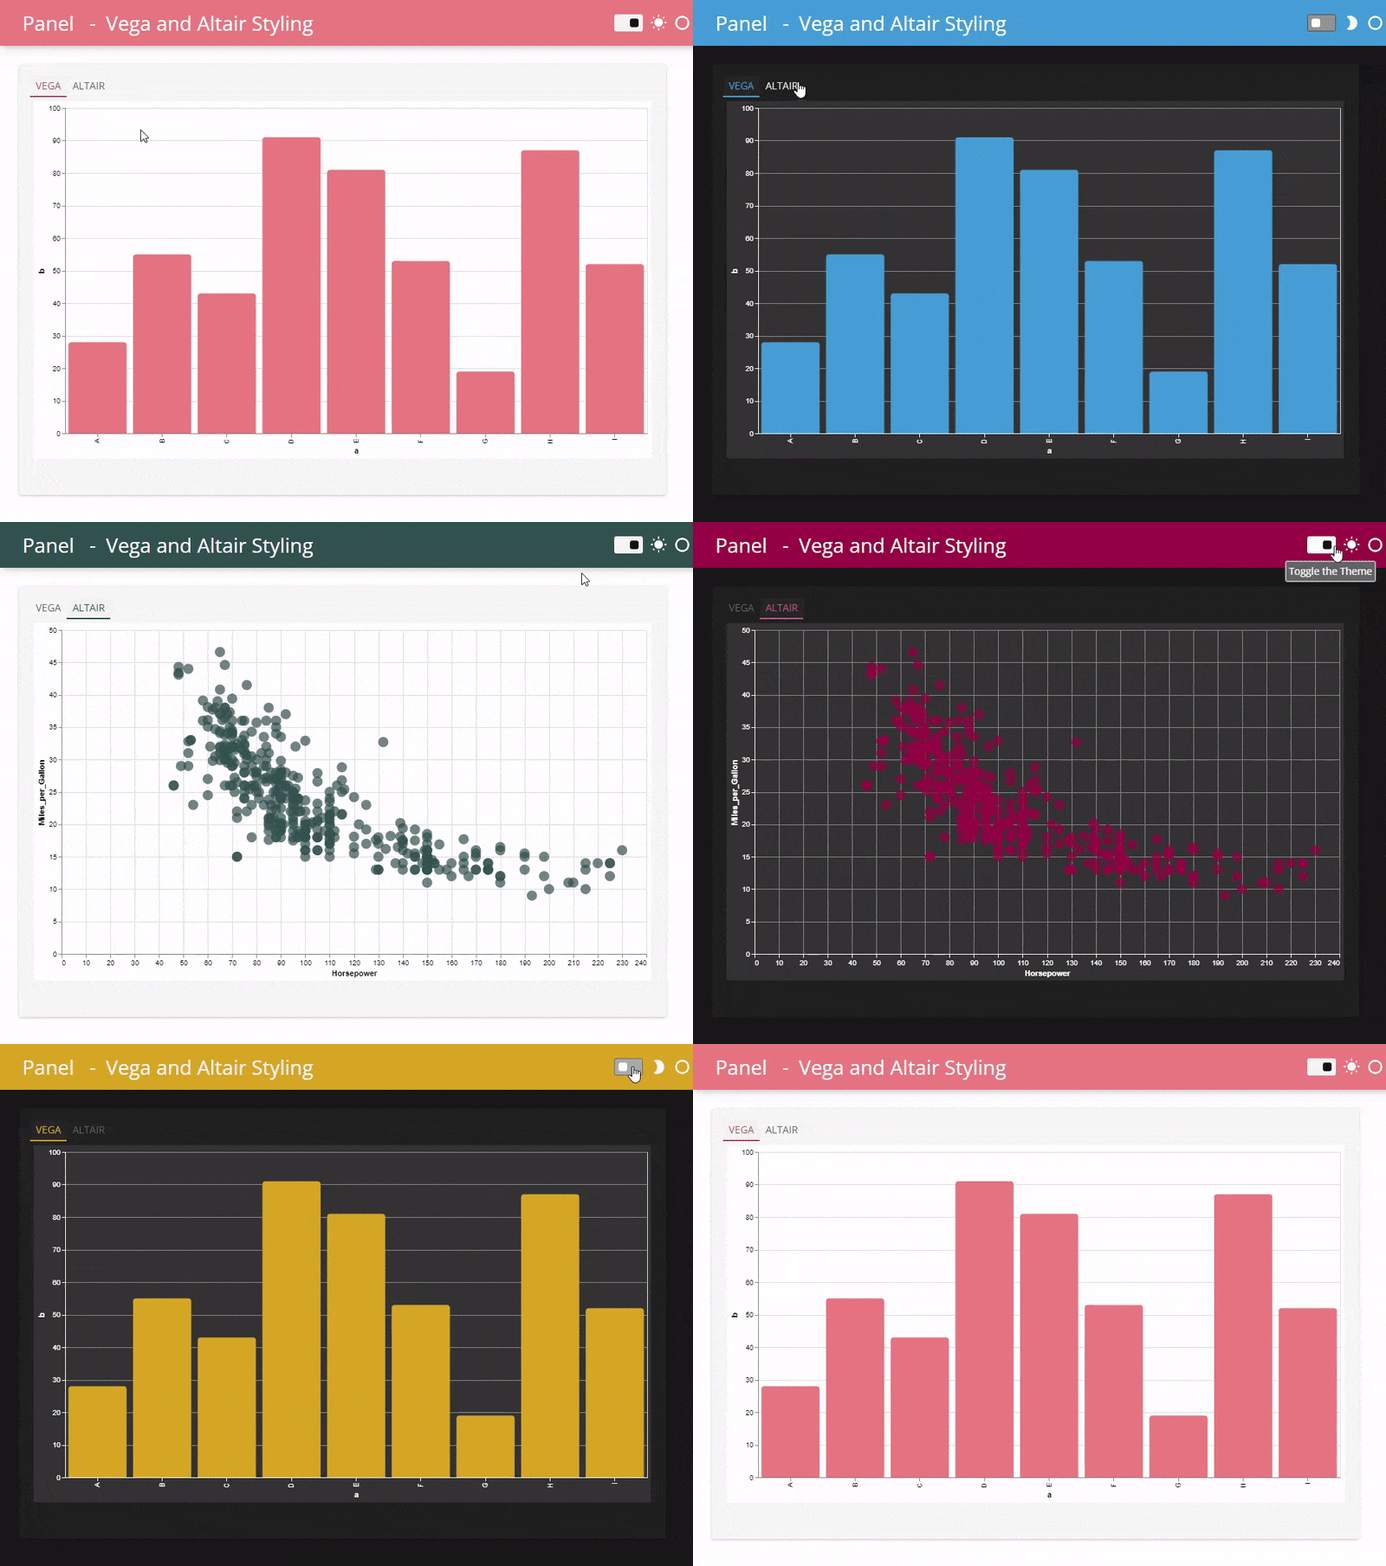
The gif below displays an example of what can be achieved with a little styling of the Altair plot and the FastListTemplate.

An Altair plot with custom theme and accent color#
In this example we will give the Altair plot a custom theme and accent color.
import altair as alt
import panel as pn

from vega_datasets import data

pn.extension("vega")

def plot(theme, color):
    alt.theme.enable(theme)

    return (
        alt.Chart(data.cars())
        .mark_circle(size=200)
        .encode(
            x='Horsepower:Q',
            y='Miles_per_Gallon:Q',
            tooltip=["Name", "Origin", "Horsepower", "Miles_per_Gallon"],
        )
        .configure_mark(
            color=color
        )
        .properties(
            height=300,
            width="container",
        )
        .interactive()
    )

themes = sorted(alt.theme.names())
theme = pn.widgets.Select(value="dark", options=themes, name="Theme")
color = pn.widgets.ColorPicker(value="#F08080", name="Color")

pn.Column(
    pn.Row(theme, color),
    pn.pane.Vega(pn.bind(plot, theme=theme, color=color), height=350, sizing_mode="stretch_width"),
    "**Altair Themes**: " + ", ".join(themes),
    styles={"border": "1px solid lightgray"}
).servable()
Please note that the line alt.theme.enable(theme) will set the theme of all future generated plots
unless you specifically change it before usage in a Vega pane.


