Style Matplotlib Plots#
This guide addresses how to style Matplotlib plots displayed using the Matplotlib pane.
There are nearly 30 builtin styles to Matplotlib that can be activated with the plt.style.use function. The style names are listed in the plt.style.available array.
For more info check out the Matplotlib style sheets reference and the alternative themes dracula theme and gadfly.
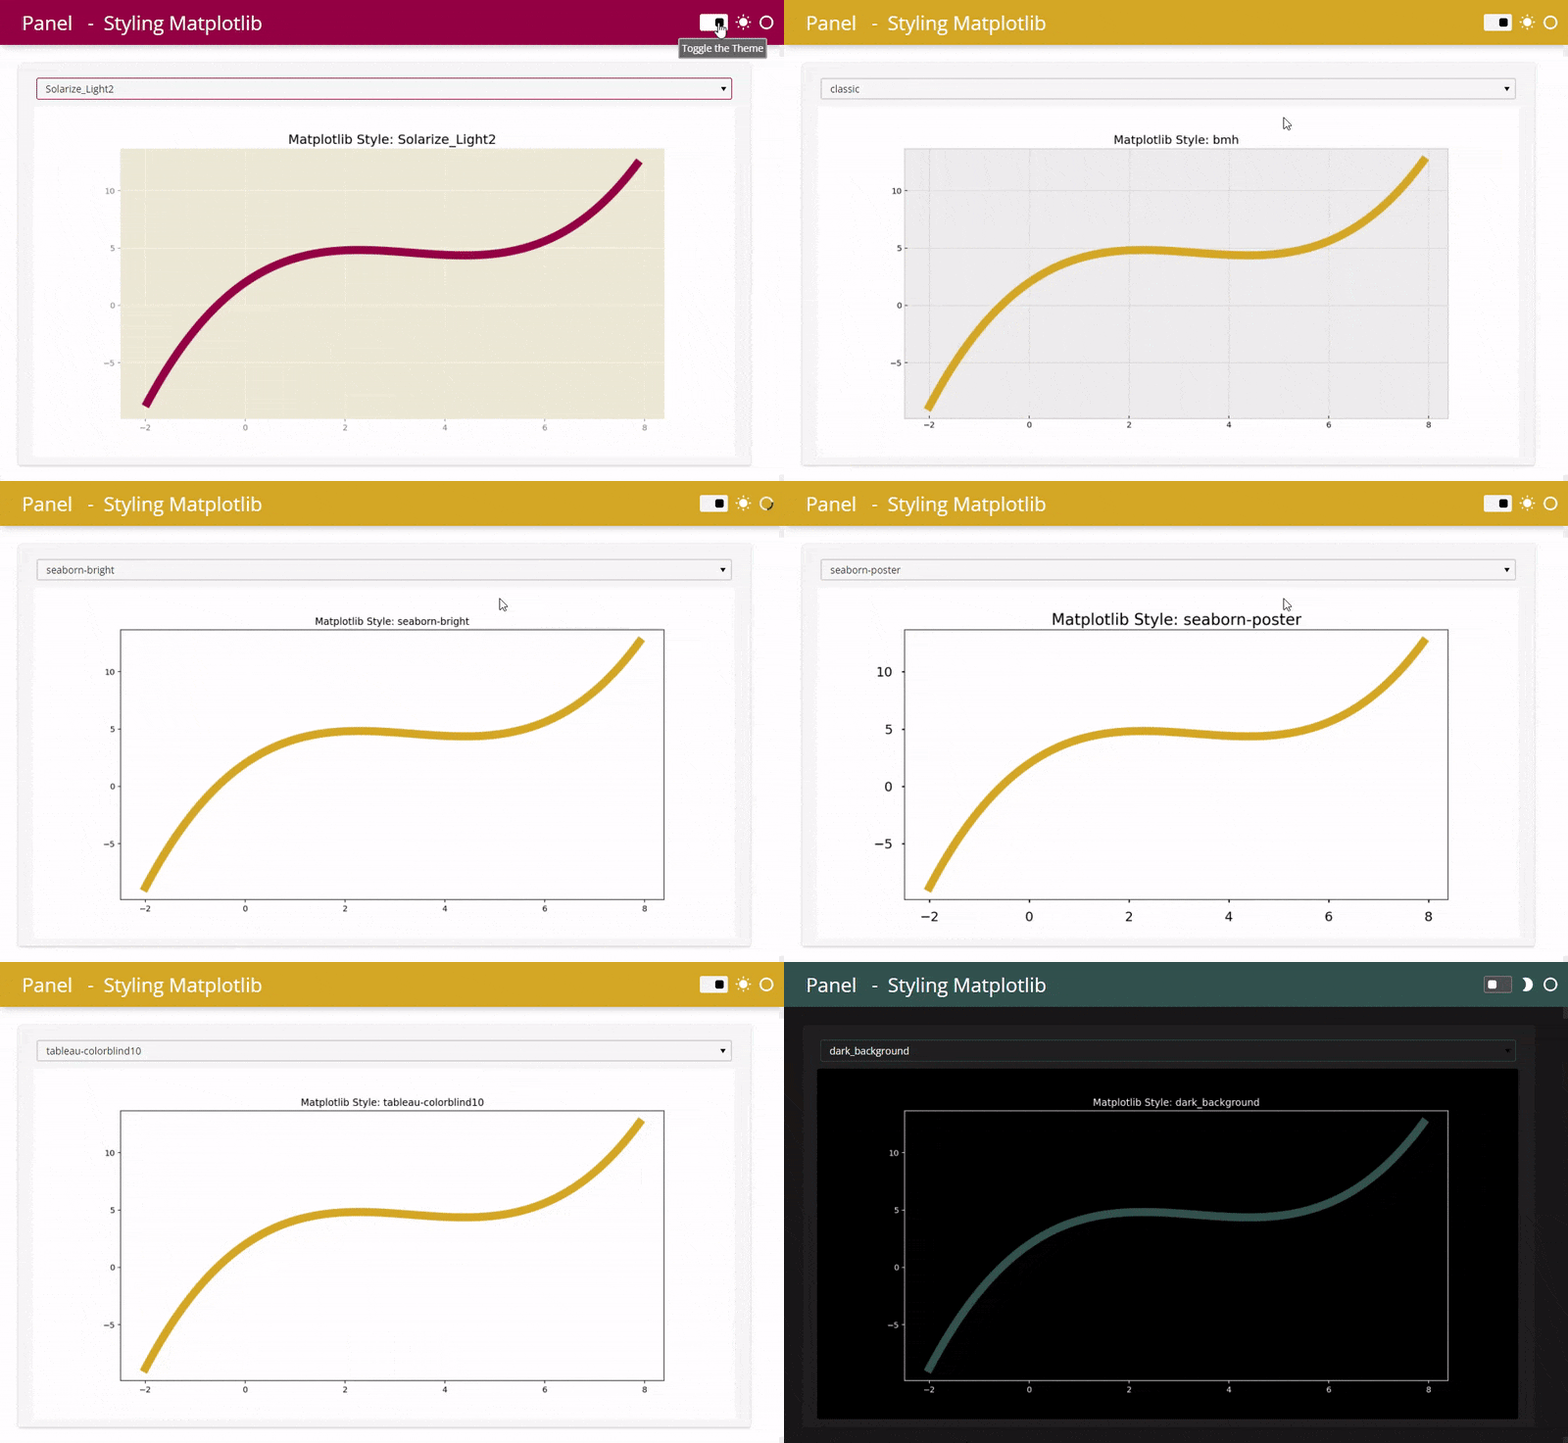
The gif below displays an example of what can be achieved with a little styling of the Matplotlib figure and the FastListTemplate.

A Matplotlib plot with custom style and accent color#
In this example we will give the Matplotlib plot a custom style and accent color.
import numpy as np

from matplotlib.figure import Figure
import matplotlib.pyplot as plt
import panel as pn

pn.extension()


def plot(style, color):
    x = np.arange(-2, 8, 0.1)
    y = 0.1 * x**3 - x**2 + 3 * x + 2

    plt.style.use("default")  # reset to not be affected by previous style changes
    plt.style.use(style)  # change to the specified style

    fig0 = Figure(figsize=(12, 6))
    ax0 = fig0.subplots()
    ax0.plot(x, y, linewidth=10.0, color=color)
    ax0.set_title(f"Matplotlib Style: {style}")

    plt.style.use("default")  # reset to not affect style of other plots

    return fig0


styles = sorted(plt.style.available)
style = pn.widgets.Select(value="dark_background", options=styles, name="Style")
color = pn.widgets.ColorPicker(value="#F08080", name="Color")

pn.Column(
    pn.Row(style, color),
    pn.pane.Matplotlib(
        pn.bind(plot, style=style, color=color),
        height=400,
        sizing_mode="fixed",
    ),
    "**Matplotlib Styles**: " + ", ".join(styles),
).servable()


