Multichannel Timeseries#

Introduction#
Visualizing time series from various sources on a vertically stacked, time-aligned display is often the first tool employed when working with data from electrophysiological studies. These experiments generally seek to provide insight into the activities of nerve cells or muscles, as well as how they relate to each other or other measurable variables, such as the spatial position of the organism under study. Electrophysiological recording sessions can include diverse data types like electromyograms (EMG), electroencephalograms (EEG), local field potentials (LFP), or neural action potentials (spikes) - each consisting of multiple streams of information (‘channels’) that all are unified by their alignment to a single series of timestamps, but having a heterogenuous range of amplitude values.
There are many different approaches for a visualization of multichannel timeseries data, but we’ll highlight the one that we’ve found to be promising in many scenarios. If you have a dataset that is too large to fit into memory, check out the alternate approaches in the ‘Extensions and Alternate Workflows’ below the Recommended Workflow.
Key Features#
Analyzing electrophysiological data often involves searching for patterns across time, channels, and covariates. Target features that support this type of investigation for time-aligned, amplitude-diverse data include:
Smooth Interactions at Scale: Smooth zooming and panning across time and channels.
Subcoordinate Axes: Independent amplitude dimension (y-axis) per channel.
Instant Inspection: Quick information preview about the data under the cursor.
Group-Aware Handling: Zooming and y-range normalization per specified channel group/type.
Reference View: Minimap for navigation and contextualization in large datasets.
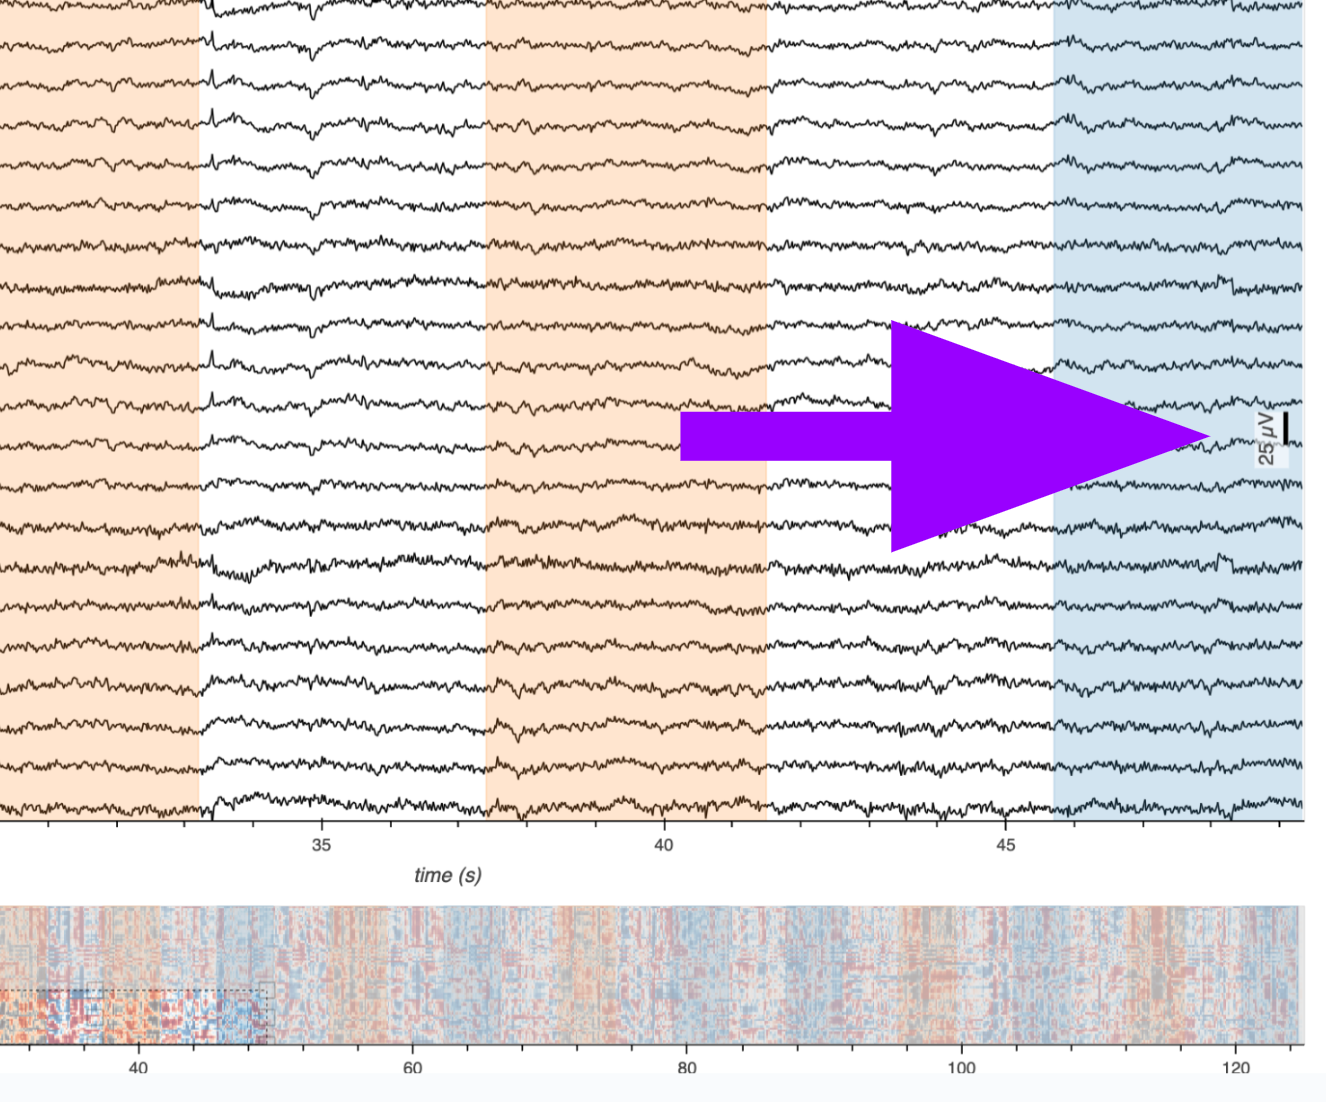
Responsive Scale Bar: Dynamic amplitude reference measurement.
Time-Range Annotations: Create and edit time-range annotations directly on the plot.
👉 Recommended Workflow (Start Here)#
The recommended multichannel timeseries notebook provides a workflow for processing and analyzing multichannel timeseries datasets that fit in memory.
It covers the importance of live downsampling using algorithms that maintain the signal shape and optimize browser performance.
Although it features the MNE-Python library for handling and visualization of raw EEG data, the concepts and methods are applicable to various timeseries data beyond EEG.
Extensions and Alternate Workflows#
Title |
Preview |
Type |
Summary |
Details |
|---|---|---|---|---|
|
Extension |
Use HoloViews RangeToolLink and Datashader to rasterize an aggregate view. |
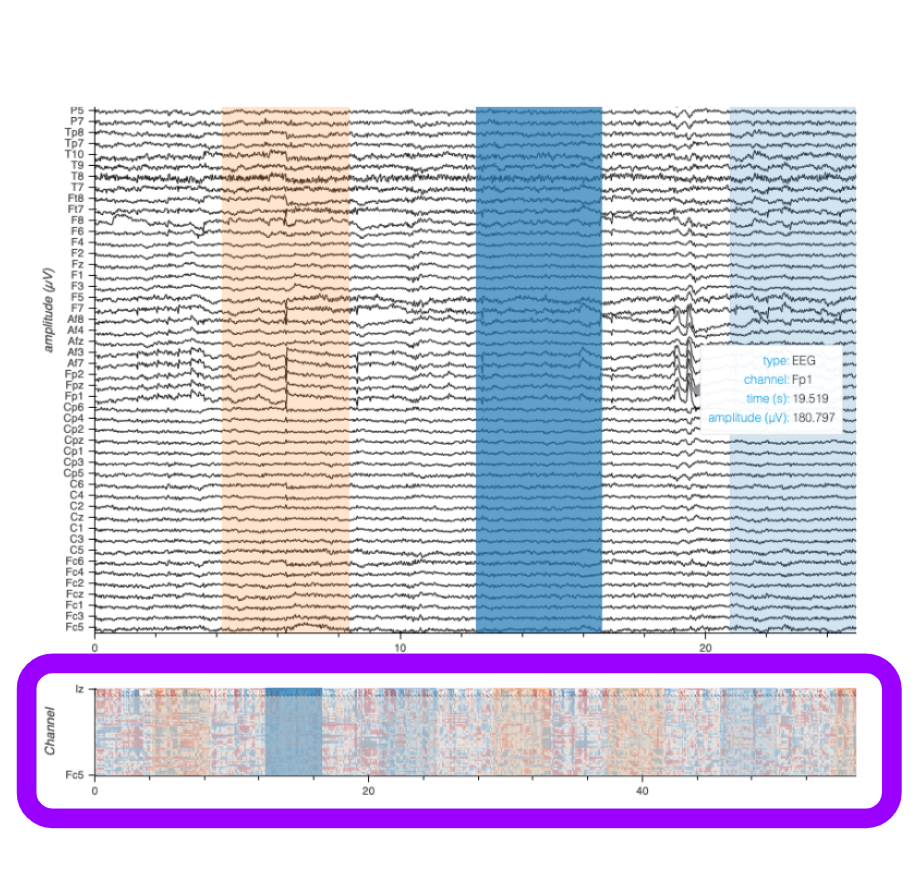
Create a minimap widget that provides a condensed overview of the entire dataset, allowing users to select and zoom into areas of interest quickly in the main plot while maintaining the contextualization of the zoomed out view. |
|
|
Extension |
Utilize HoloNote along with any primary workflow approach. |
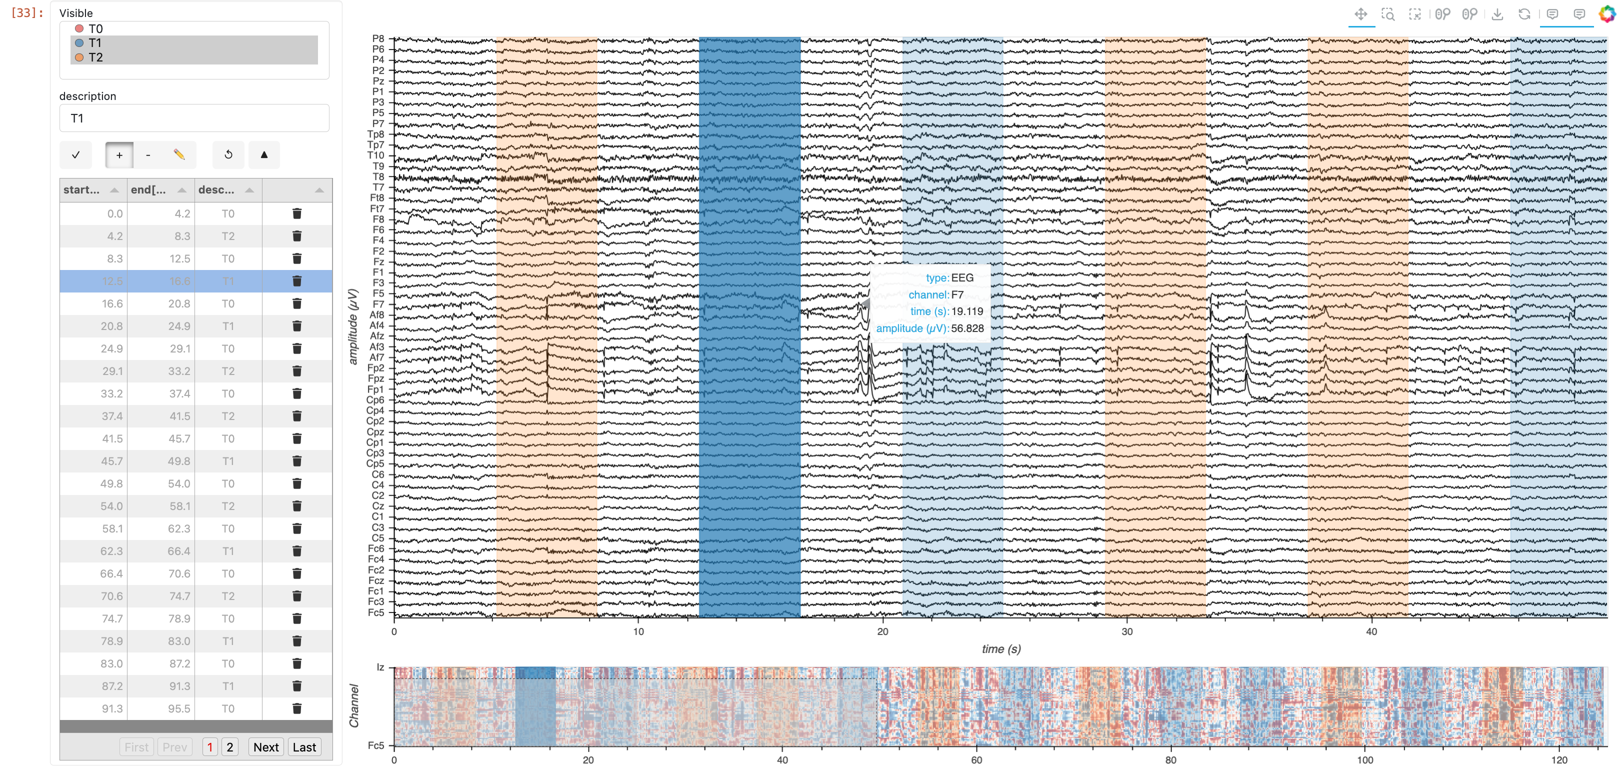
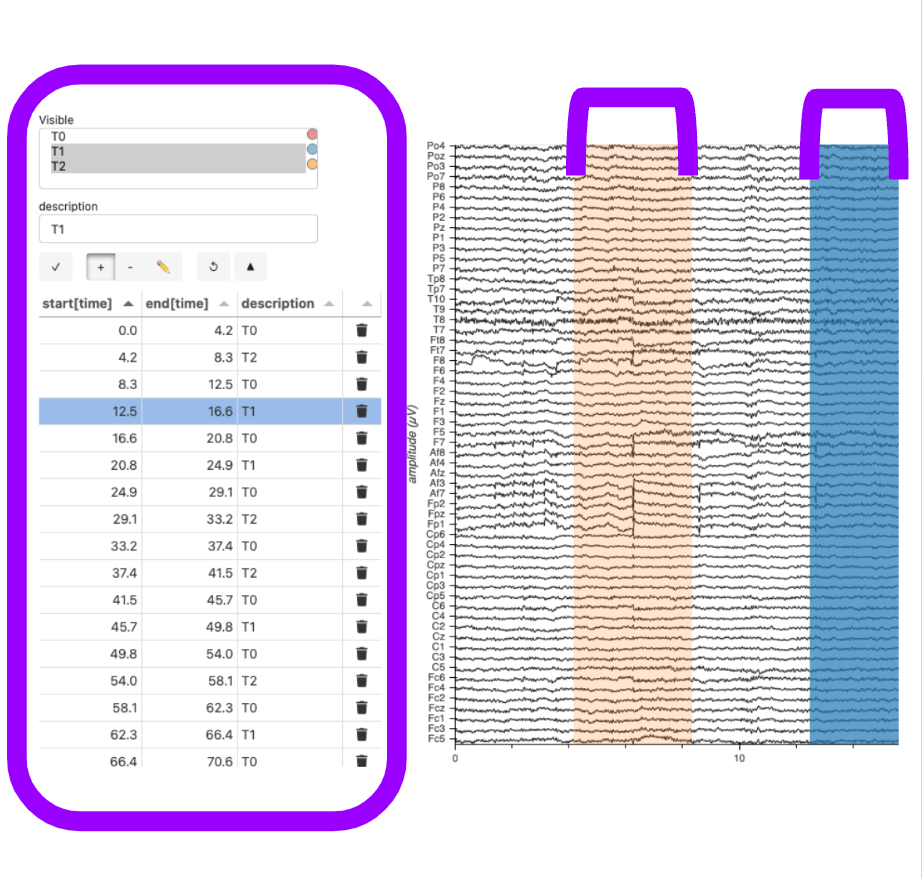
Create (or import), edit, and save a table of start and end times. View the categorized ranges overlaid on the multichannel timeseries plot. HoloNote allows you to interact with time range annotations directly on a plot, through widgets, or programmatically. |
|
|
Extension |
Deploy the visualization as a standalone, template-styled web application using HoloViz Panel. |
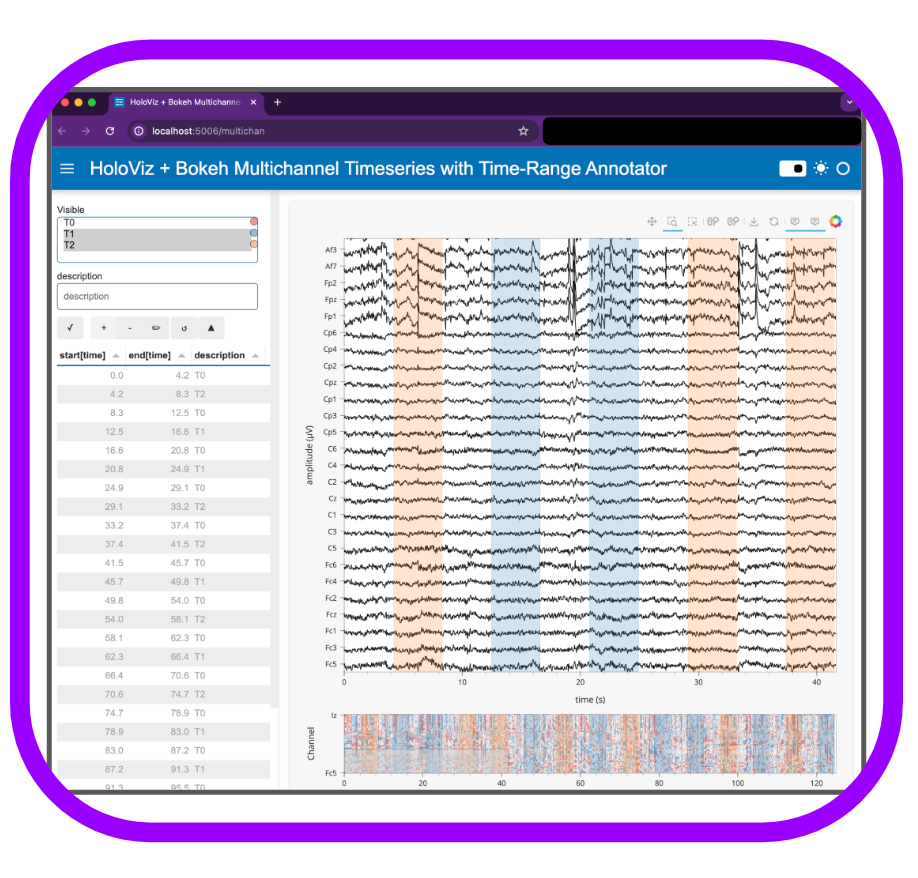
This extension shows how to wrap your plot within a Panel Template for a styled, interactive web app that can run outside of a Jupyter Notebook. By marking the Panel component as servable, you can launch the app directly from the command line, providing a user-friendly interface in its own browser window. |
|
|
Extension |
Provides an accurate, dynamic, and customizable reference gauge of signal amplitude. |
The scale bar feature in HoloViews+Bokeh allows for precise measurement indicators on plots. Requires Bokeh>=3.6.0 and HoloViews>=1.19.2 |
|
|
Alternate Workflow |
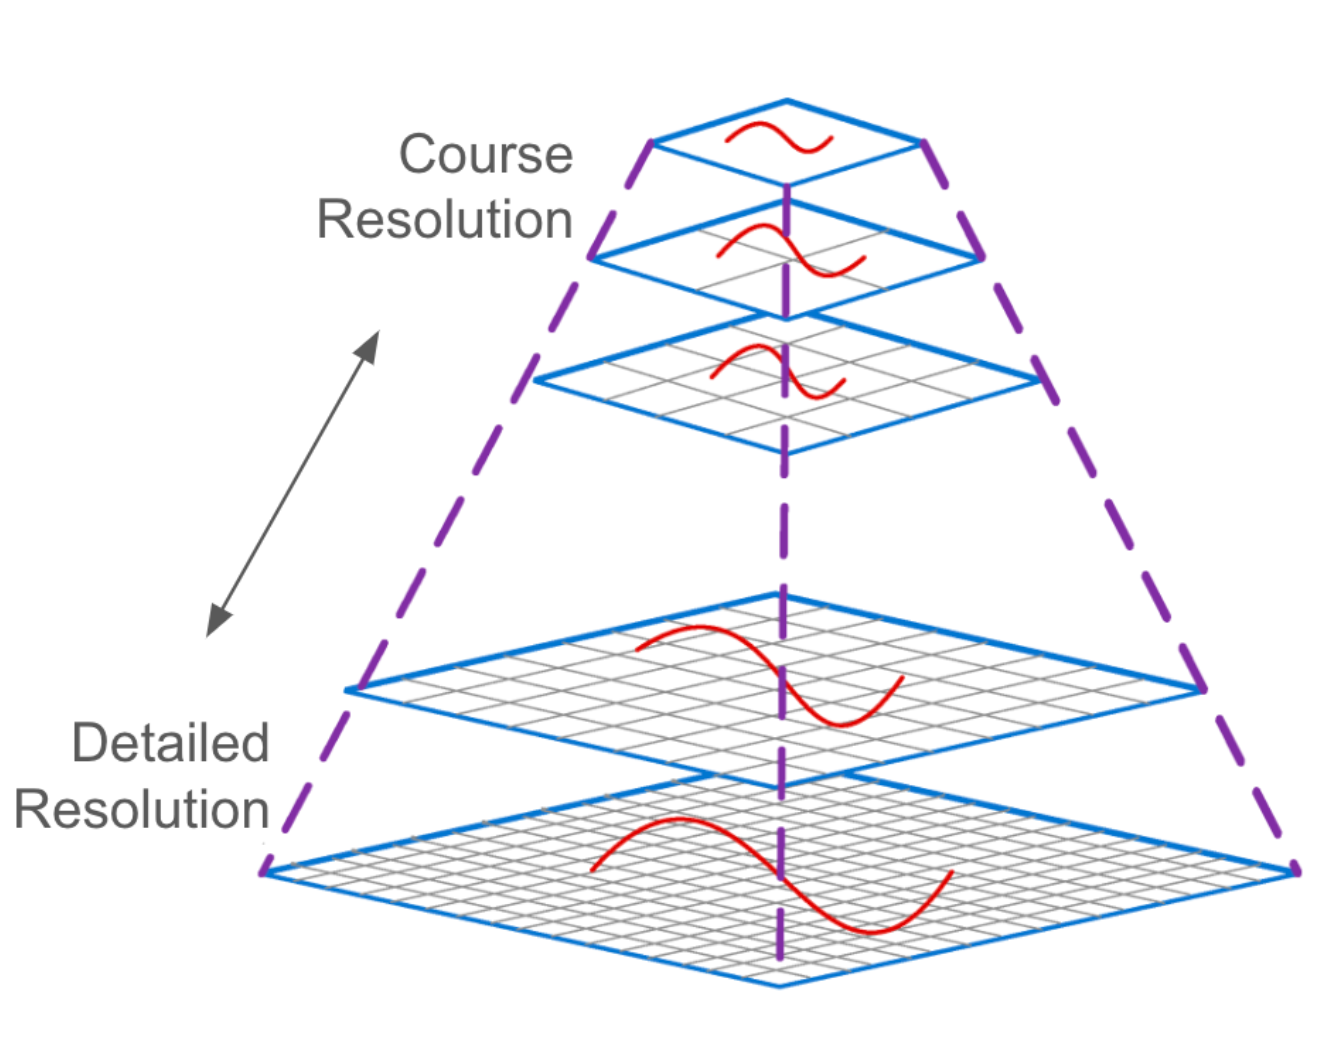
Utilize Xarray, Zarr, and Dask for dynamic access of data subsets at optimal resolution. |
To handle datasets beyond available memory (RAM), we can utilize dynamic access of certain data ranges and resolutions, using a precomputed hierarchical array pyramid. |
|
|
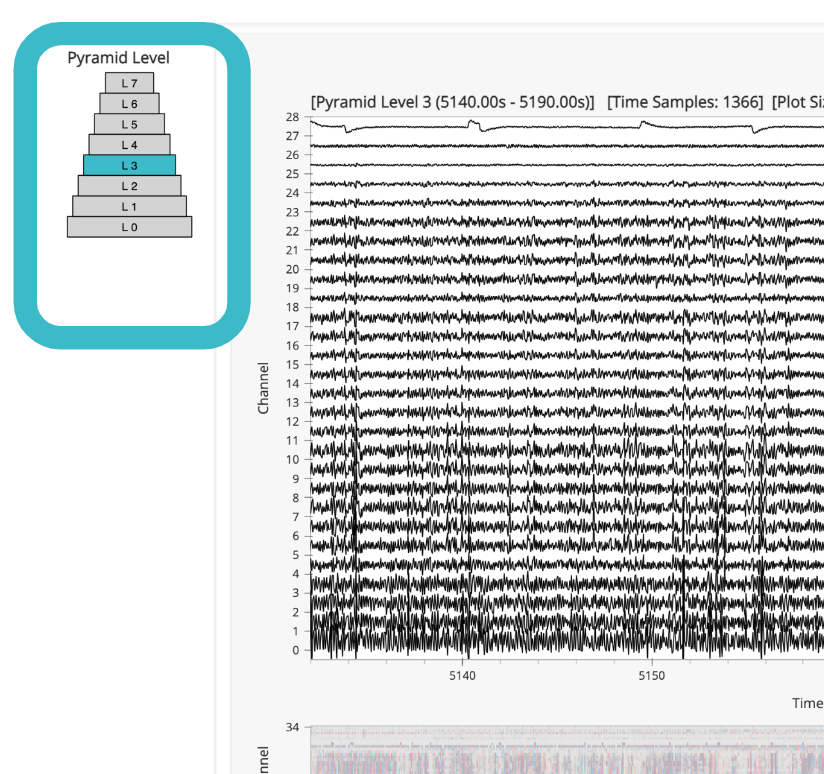
Extension |
Indicator for the active Pyramid Level |
Use a custom HoloViews Stream to update the indicator styling of the different resolution levels of the data |
Funding:#
2023 - 2024: Chan Zuckerberg Initiative. Learn more in the grant announcement.
Project Lead: Demetris Roumis, PhD (@droumis on HoloViz Discord)