"""A NYT-style graphic story built with panel-material-ui.

A scrollable editorial article: a masthead, a narrow reading column, and prose
interleaved with explanatory charts (takeaway titles, one highlight color, direct
inline labels, annotations, no toolbars). Each chart follows the hvplot
`distilling-explanatory-plots` reference; this file is the Panel shell that stacks them into
a narrative.

Run with:  panel serve graphic_story.py --show
"""

import holoviews as hv
import numpy as np
import pandas as pd
import panel as pn
import panel_material_ui as pmui
from bokeh.themes.theme import Theme

hv.extension("bokeh")
hv.opts.defaults(
    hv.opts.Overlay(active_tools=["pan"], tools=["pan", "reset"]),
    hv.opts.Curve(fontscale=1.4),
    hv.opts.Scatter(fontscale=1.4),
)
pn.extension()

df = pd.read_csv("https://raw.githubusercontent.com/mwaskom/seaborn-data/master/mpg.csv")
df["year"] = 1900 + df["model_year"]
df["origin_name"] = df["origin"].map({"usa": "American", "europe": "European", "japan": "Japanese"})

RED, BLUE, GRAY, GRAYLINE = "#c0392b", "#2c7fb8", "#cfcfcf", "#9e9e9e"
W, H = 620, 320
FS = {"title": 14, "labels": 11, "ticks": 10}
FONT = "Arial, Helvetica, sans-serif"

# Bokeh theme — replaces all the per-plot backend_opts
hv.renderer("bokeh").theme = Theme(
    json={
        "attrs": {
            "figure": {
                "outline_line_color": None,
            },
            "Axis": {
                "major_tick_line_color": None,
                "minor_tick_line_color": None,
                "axis_label_text_font": FONT,
                "axis_label_text_font_style": "normal",
                "axis_label_text_font_size": "13px",
                "major_label_text_font": FONT,
                "major_label_text_font_size": "13px",
            },
            "YAxis": {
                "axis_line_color": None,  # remove left spine
            },
            "XAxis": {
                "axis_line_color": "#cccccc",  # keep subtle baseline
            },
            "Title": {
                "text_font": FONT,
                "text_font_style": "normal",
                "text_font_size": "16px",
            },
        }
    }
)


def style(el, title, xlabel=""):
    """Shared styling so every chart in the piece reads as one visual family."""
    return el.opts(
        toolbar=None,
        show_frame=False,
        show_grid=True,
        gridstyle={"ygrid_line_color": "#e0e0e0", "ygrid_line_width": 1, "xgrid_line_color": None},
        width=W,
        height=H,
        title=title,
        fontsize=FS,
        xlabel=xlabel,
        ylabel="mpg",
    )


# 1 — the trend, with the oil shocks annotated in place
yr = df.groupby("year")["mpg"].median().reset_index()
c1 = (
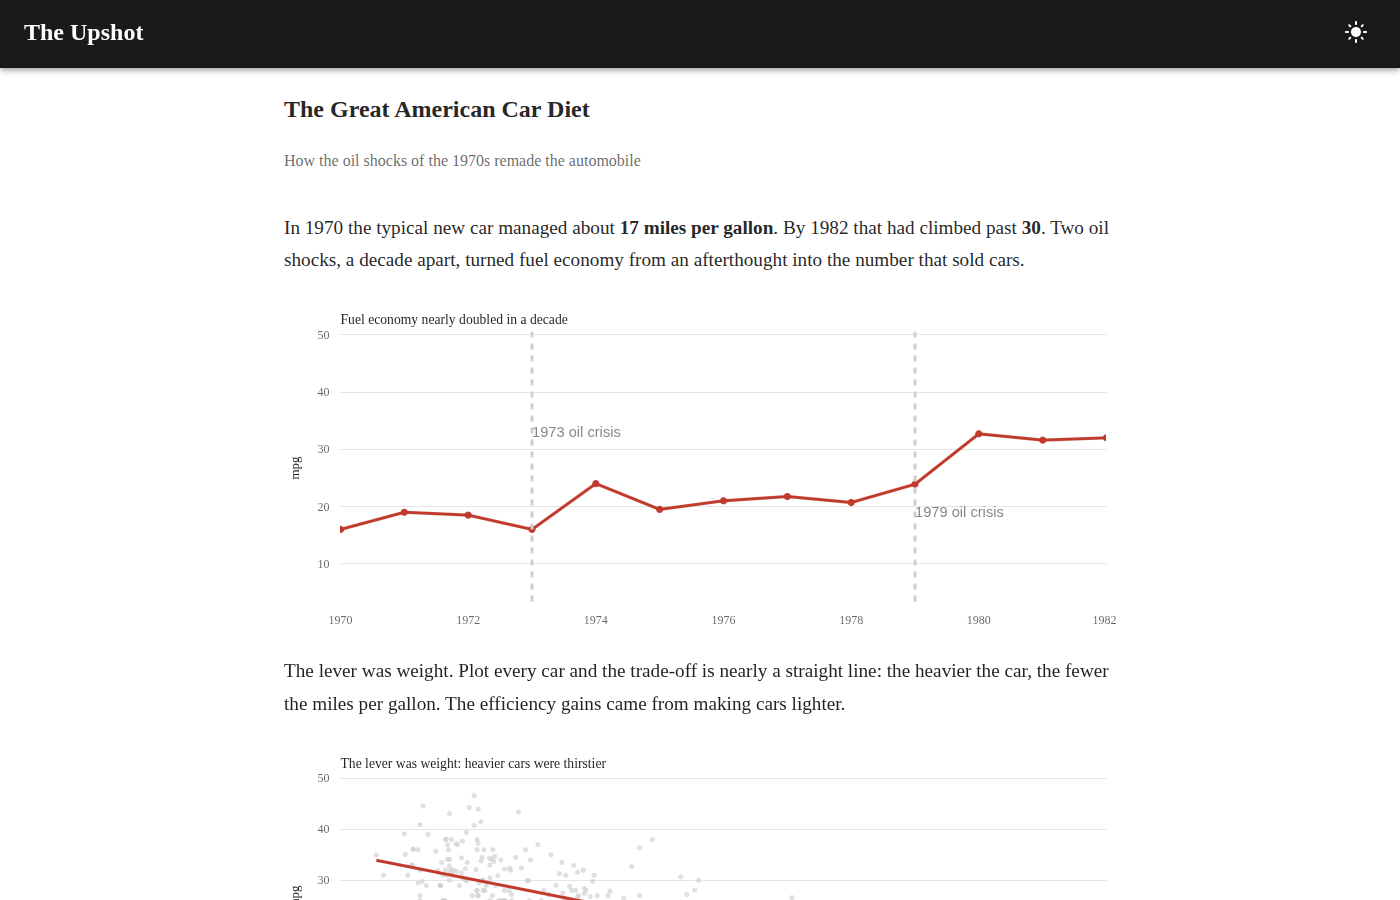
    hv.Curve(yr, "year", "mpg").opts(color=RED, line_width=3)
    * hv.Scatter(yr, "year", "mpg").opts(color=RED, size=6)
    * hv.VLine(1973).opts(color=GRAY, line_dash="dashed")
    * hv.VLine(1979).opts(color=GRAY, line_dash="dashed")
    * hv.Text(1973, 33, "1973 oil crisis").opts(
        text_font_size="11pt", text_color="#888", text_align="left"
    )
    * hv.Text(1979, 19, "1979 oil crisis").opts(
        text_font_size="11pt", text_color="#888", text_align="left"
    )
)
c1 = style(c1, "Fuel economy nearly doubled in a decade").opts(xlim=(1970, 1982), ylim=(10, 38))

# 2 — the mechanism: the whole cloud, with a trend line
d2 = df.dropna(subset=["weight", "mpg"])
m, b = np.polyfit(d2["weight"], d2["mpg"], 1)
xs = np.array([d2["weight"].min(), d2["weight"].max()])
c2 = hv.Scatter(d2, "weight", "mpg").opts(color=GRAY, size=4, alpha=0.6) * hv.Curve(
    (xs, m * xs + b)
).opts(color=RED, line_width=3)
c2 = style(c2, "The lever was weight: heavier cars were thirstier", xlabel="weight (lbs)")

# 3 — three series, identified by direct inline labels instead of a legend
yo = df.groupby(["year", "origin_name"])["mpg"].median().reset_index()


def oline(name, color, width, dy=0):
    d = yo[yo.origin_name == name].sort_values("year")
    lab = hv.Text(d.iloc[-1].year + 0.25, d.iloc[-1].mpg + dy, name).opts(
        text_font_size="12pt", text_color=color, text_align="left", text_font_style="bold"
    )
    return hv.Curve(d, "year", "mpg").opts(color=color, line_width=width) * lab


c3 = (
    oline("European", GRAYLINE, 2, dy=1.2)
    * oline("Japanese", BLUE, 2.5, dy=-1.2)
    * oline("American", RED, 3)
)
c3 = style(c3, "American cars started far behind, then closed the gap").opts(
    show_legend=False, xlim=(1970, 1985), ylim=(12, 42), shared_axes=False
)


def pullquote(text):
    """A single bold stat set large — breaks up prose rhythm like NYT's big-number callouts."""
    return pn.pane.Markdown(
        text,
        styles={
            "font-size": "1.75em",
            "font-weight": "700",
            "line-height": "1.2",
            "color": RED,
            "border-left": f"4px solid {RED}",
            "padding-left": "16px",
            "margin": "24px 12px 0px 12px",
            "font-family": FONT,
        },
    )


# 4 — the engine mix: V8 dominance collapsed as 4-cylinders surged
cyl_yr = (
    df.groupby(["year", "cylinders"])
    .size()
    .reset_index(name="count")
    .assign(share=lambda d: d["count"] / d.groupby("year")["count"].transform("sum") * 100)
)
four = cyl_yr[cyl_yr.cylinders == 4]
eight = cyl_yr[cyl_yr.cylinders == 8]

c4 = (
    hv.Area(eight, "year", "share").opts(color=GRAY, alpha=0.4, line_width=0)
    * hv.Curve(eight, "year", "share").opts(color=GRAYLINE, line_width=2)
    * hv.Text(1971.5, eight[eight.year == 1971]["share"].values[0] + 3, "V8").opts(
        text_font_size="12pt", text_color=GRAYLINE, text_font_style="bold"
    )
    * hv.Area(four, "year", "share").opts(color=RED, alpha=0.15, line_width=0)
    * hv.Curve(four, "year", "share").opts(color=RED, line_width=2.5)
    * hv.Text(1981, four[four.year == 1981]["share"].values[0] + 10, "4-cyl").opts(
        text_font_size="12pt", text_color=RED, text_font_style="bold"
    )
)
c4 = style(c4, "4-cylinder engines went from niche to majority", xlabel="").opts(
    show_legend=False, ylabel="share of new cars (%)", xlim=(1970, 1982), ylim=(0, 100)
)


def prose(text):
    # Markdown, not Typography, so inline **bold** and `code` render.
    return pn.pane.Markdown(
        text, styles={"font-size": "1.2em", "line-height": "1.7", "color": "inherit"}
    )


def source(text):
    """Small gray source/note line — sits below a chart, flush left."""
    return pn.pane.Markdown(
        text,
        styles={
            "font-size": "12px",
            "color": "#888",
            "font-family": "Arial, Helvetica, sans-serif",
        },
    )


article = pn.Column(
    pmui.Typography("The Great American Car Diet", variant="h3", sx={"fontWeight": 700, "mt": 2}),
    pmui.Typography(
        "How the oil shocks of the 1970s remade the automobile",
        variant="subtitle1",
        sx={"color": "text.secondary", "mb": 1},
    ),
    prose(
        "In 1970 the typical new car managed about **17 miles per gallon**. By 1982 that had "
        "climbed past **30**. Two oil shocks, a decade apart, turned fuel economy from an "
        "afterthought into the number that sold cars."
    ),
    pn.pane.HoloViews(c1, sizing_mode="stretch_width"),
    prose(
        "The lever was weight. Plot every car and the trade-off is nearly a straight line: the "
        "heavier the car, the fewer the miles per gallon. The efficiency gains came from making "
        "cars lighter."
    ),
    pn.pane.HoloViews(c2, sizing_mode="stretch_width"),
    prose(
        "Not everyone started in the same place. American cars were the heaviest and thirstiest "
        "in 1970, while Japanese imports were already frugal. The gap narrowed as "
        "Detroit caught up."
    ),
    pn.pane.HoloViews(c3, sizing_mode="stretch_width"),
    pullquote("The share of 4-cylinder cars rose from 25% in 1970 to over 60% by 1982."),
    prose(
        "The engine told the whole story. V8s had defined the American car for a generation — "
        "powerful, heavy, thirsty. As fuel prices surged, buyers switched and manufacturers "
        "followed. By 1982 the 4-cylinder was the default, not the economy option."
    ),
    pn.pane.HoloViews(c4, sizing_mode="stretch_width"),
    source("Source: UCI / seaborn `mpg` sample dataset, model years 1970–1982."),
    sizing_mode="stretch_width",
)

THEME = {
    "palette": {"primary": {"main": "#1a1a1a"}},  # dark, understated masthead
    "typography": {"fontFamily": "Georgia, 'Times New Roman', serif"},  # editorial serif
}

pmui.Page(
    title="The Upshot",
    theme_config=THEME,
    main=[pmui.Container(article, width_option="md")],  # clamp to a readable column
).servable()