Precipitation
US precipitation data with geographic visualizations and temporal analysis.
Features
- Geographic visualization - Precipitation patterns across the US
- Time series - Historical precipitation trends
- Regional analysis - Compare different areas
YAML Specification
| precipitation.yaml |
|---|
| config:
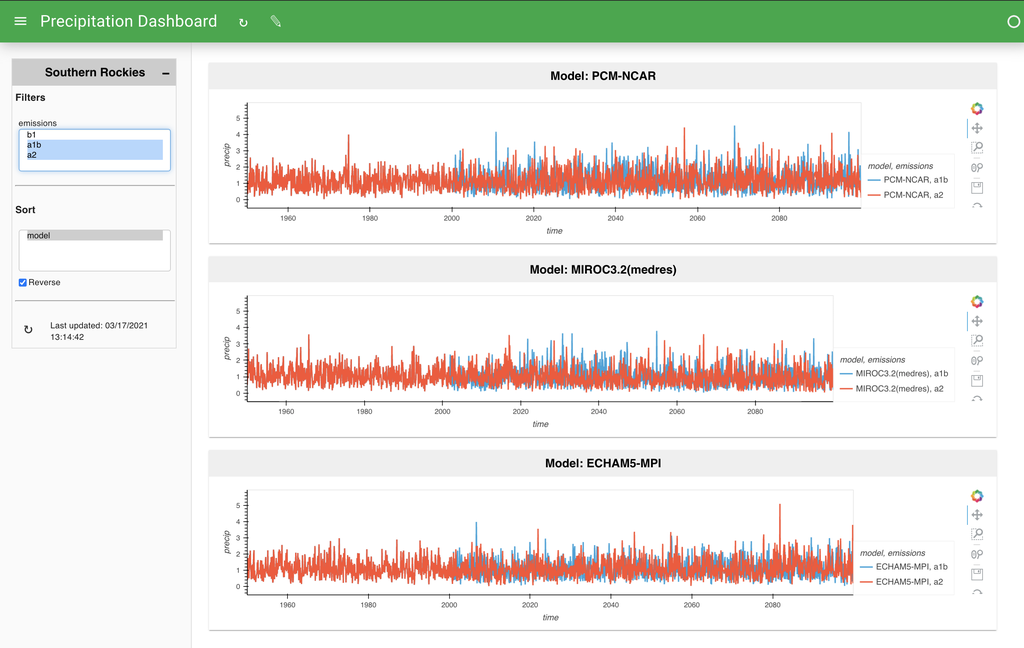
title: "Precipitation Dashboard"
sources:
rockies:
type: intake
shared: true
cache_dir: cache
catalog:
sources:
southern_rockies:
driver: csv
args:
urlpath: 's3://datasets.holoviz.org/precipitation/v1/SRLCC_{emissions}_Precip_{model}.csv'
csv_kwargs:
skiprows: 3
names: ['time', 'precip']
parse_dates: ['time']
storage_options:
anon: true
pipelines:
rockies:
source: rockies
table: southern_rockies
filters:
- type: widget
field: model
- type: widget
field: model
layouts:
- title: Southern Rockies
pipeline: rockies
height: 250
facet:
by: [model]
layout: column
views:
- type: hvplot
kind: line
x: time
y: precip
by: [model, emissions]
height: 200
responsive: true
|
Run this example
Save the YAML above as precipitation.yaml and run:
lumen serve precipitation.yaml --show
Download YAML